Why Your RAG App Is Slow (and how to prove it)
Search for a command to run...
No comments yet. Be the first to comment.
It’s 2026. If you are still manually updating CSS selectors because a div moved three pixels to the left, you are doing it wrong. For the last decade, we’ve been stuck in a loop of "write, break, fix,

It is 2026. GPT-5, DeepSeek V3.2, Gemini 3 pro… are here, and reasoning capabilities are nothing short of extraordinary. But let’s be honest: if your RAG (Retrieval-Augmented Generation) pipeline feed
The "Notebook Phase" is the most dangerous place in AI engineering. We’ve all been there. You hack together a prompt, chain a few API calls in a Jupyter notebook, and hit Shift+Enter. The output is magic. You show your PM, they’re thrilled, and you s...

If I see one more "vibe check" evaluation in a pull request, I’m going to scream. You know the drill. You tweak the prompt, you run a few queries in the playground, it "feels" better, and you merge. Two days later, a user asks a question about a spec...
You hit "Enter."
The loading spinner starts spinning. You wait. You take a sip of coffee. You wait some more. Finally, five seconds later, the LLM spits out an answer.

It’s accurate, sure. But in the world of software, five seconds is an eternity.
When you’re building a prototype on a weekend, latency is an afterthought. But when you move that RAG (Retrieval-Augmented Generation) application to production, "it feels slow" isn't a bug report you can act on. You can’t optimize "feelings."
This is where most AI engineers hit a wall. We treat the LLM as a black box: Input goes in, magic happens, output comes out. But if you want to fix the lag, you need to stop looking at the box and start looking at the Trace.
Here is how I went from guessing to knowing, by dissecting the anatomy of a single LLM request.
The biggest misconception is that the Large Language Model is the slow part. We assume GPT-5 or Llama-4 is just taking its sweet time "thinking."
But a modern RAG pipeline is actually a relay race. Before the LLM even sees your prompt, a dozen other things have to happen. If we map it out, it usually looks like this:
Retrieval: Searching your vector database for relevant documents.
Re-ranking: Using a secondary model to sort those documents by quality (often the silent killer of performance).
Context Stuffing: Formatting those documents into a massive prompt string.
Generation: Finally, the LLM generates tokens.
If your app takes five seconds, and the Generation step only took 0.5 seconds, buying a faster GPU won’t help you. You need to see the waterfall.
To see this invisible relay race, I decided to instrument my app. I didn't want to send my data to a third-party cloud just yet, so I spun up Langfuse using a local Docker container. It’s open-source, self-hostable, and frankly, easiest to set up for a quick sanity check.
The goal wasn't to rewrite my application. I just wanted to wrap my existing functions in "spans." A span is just a unit of work - a timer that starts when a function opens and stops when it closes.
I instrumented the key suspects: my vector search function, my re-ranker, and the actual call to the LLM. Then, I fired off a request:
"Summarize the Q3 financial report focusing on renewable energy investments."
The spinner spun. The answer appeared. But this time, I wasn't looking at the chat window. I was looking at the Langfuse dashboard.
What I saw on the screen completely changed my debugging strategy.
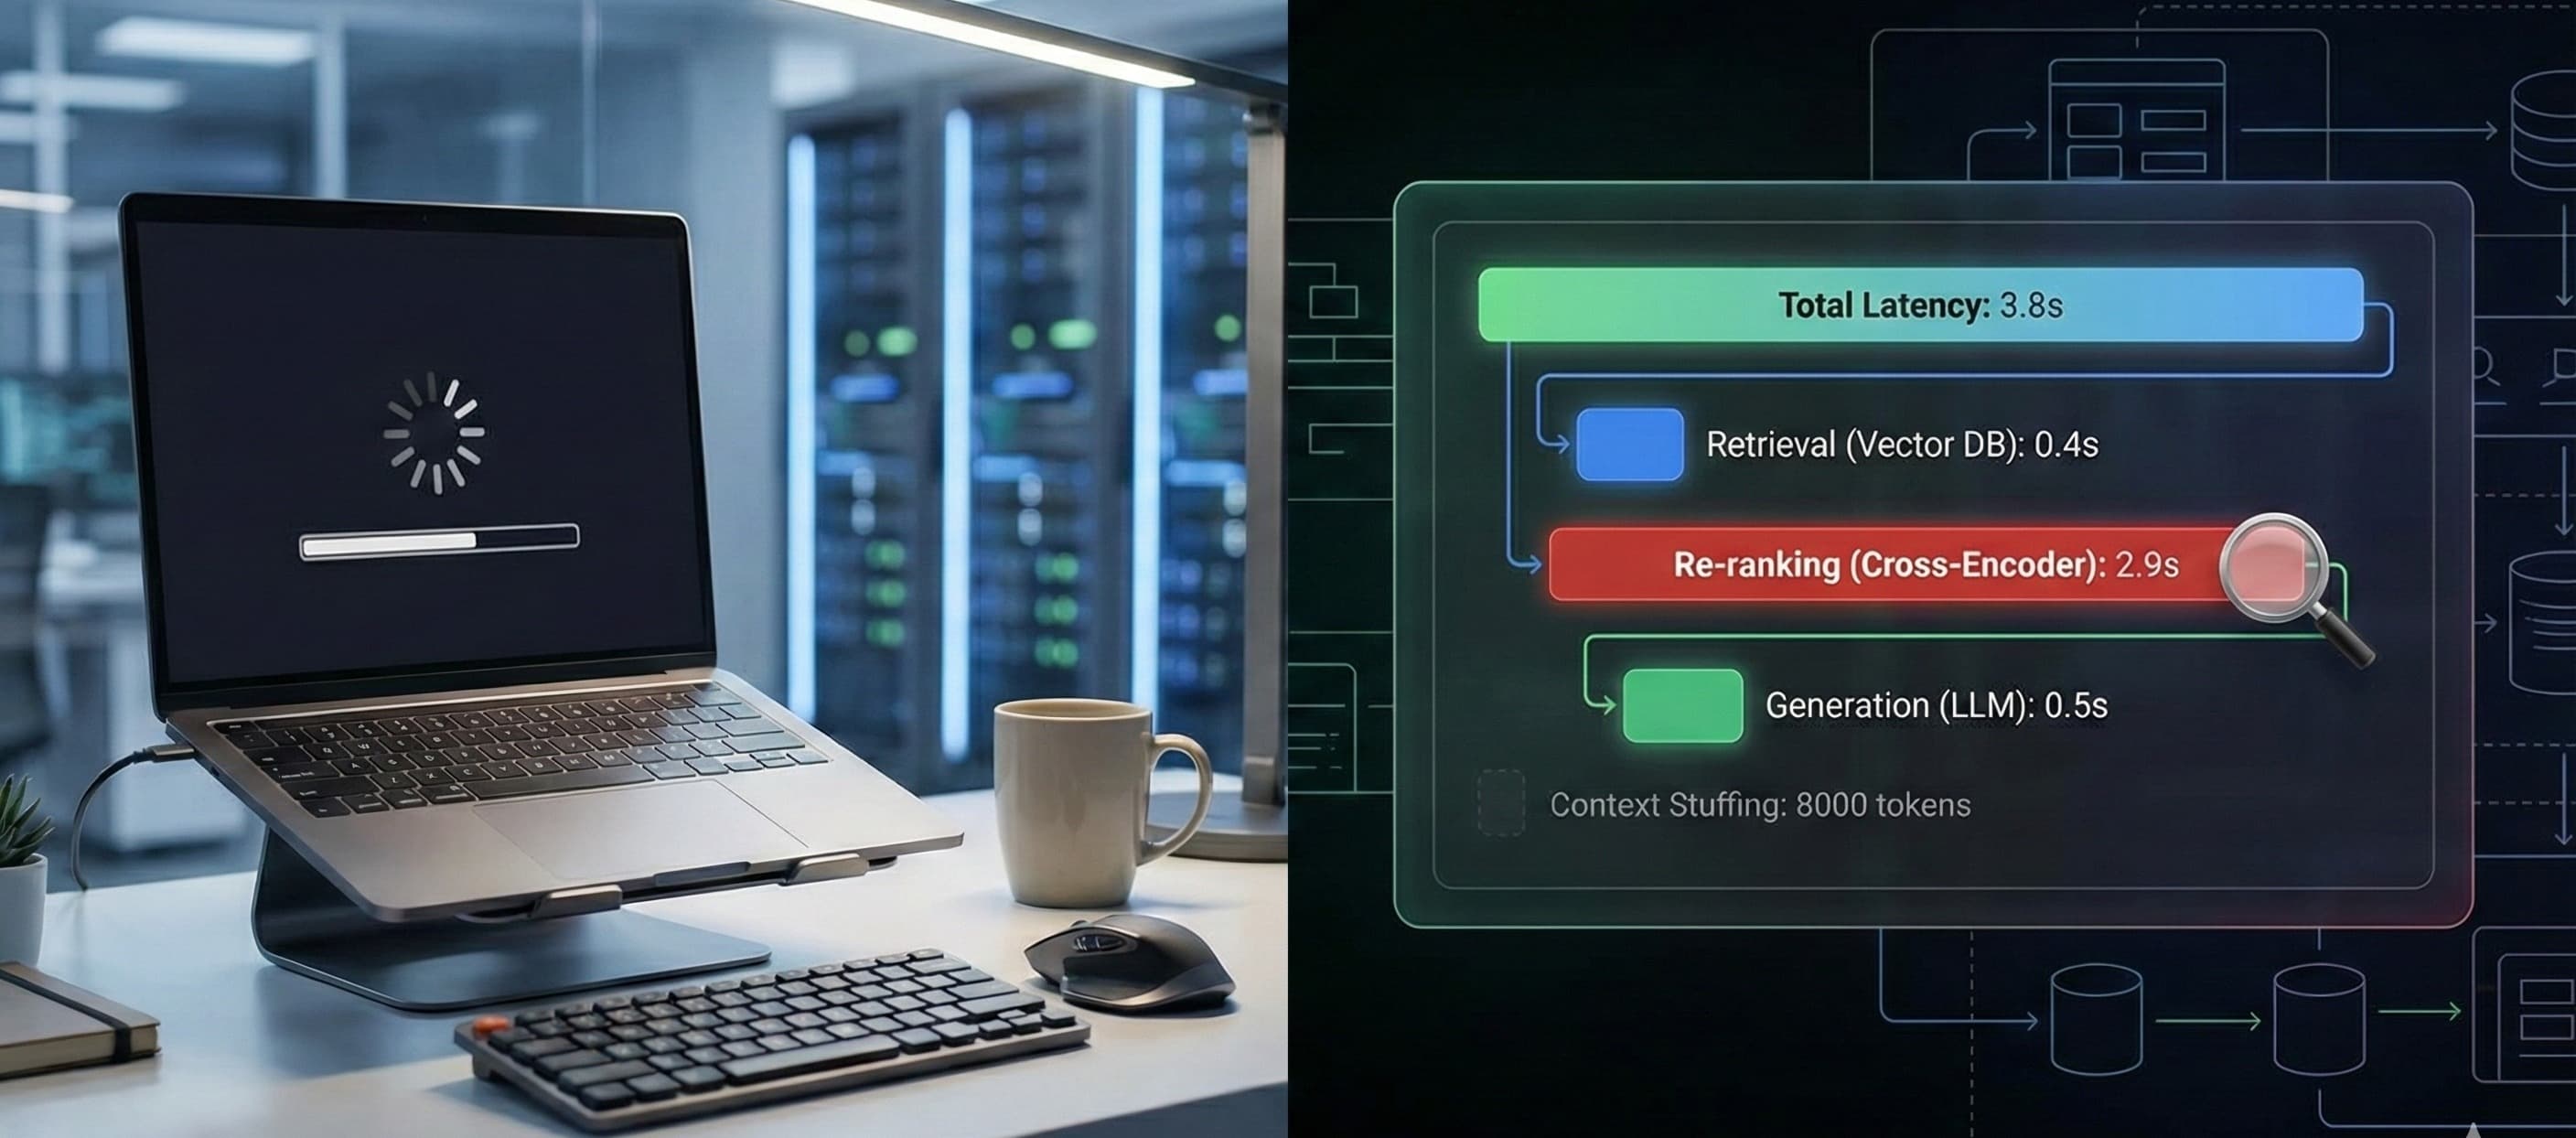
Instead of a single bar saying "Total Time: 3.8s," I saw a cascading waterfall chart - the anatomy of the trace. It looked like a timeline, broken down by color.
The Breakdown:
Total Latency: 3.8s (The user's wait time).
Span A (Retrieval): 0.4s. The vector database was blazing fast. No issues there.
Span B (Re-ranking): 2.9s. There it was. The red flag.
Span C (Generation): 0.5s. The LLM was actually incredibly snappy.
Without this trace, I would have wasted days trying to switch to a faster LLM provider or optimizing my prompt.
The trace revealed the truth: My re-ranking step - where I used a high-precision Cross-Encoder to filter documents - was doing too much heavy lifting. It was processing 50 documents when I only needed the top 5.
The trace also showed me the Context Stuffing step. I could click into the span and see the exact payload sent to the model. I realized I was accidentally injecting 8,000 tokens of context for a simple summary, which was costing me money and adding processing overhead.
We are moving past the era of "vibes-based" engineering.
If you are building LLM applications, you are no longer just a prompt engineer; you are a systems engineer. You are managing network calls, database latencies, and token budgets.
A trace turns a generic complaint like "it's slow" into a precise engineering ticket: "Optimize Re-ranker batch size from 50 to 10."
So, before you start tweaking your prompts or switching models, do yourself a favor. Spin up a tracer, instrument your chain, and look at the anatomy of your request. You might be surprised by what’s actually eating your clock.